 Nic Dunn, CEO, Charle Agency
What a Good Ecommerce Conversion Rate Looks Like in 2026
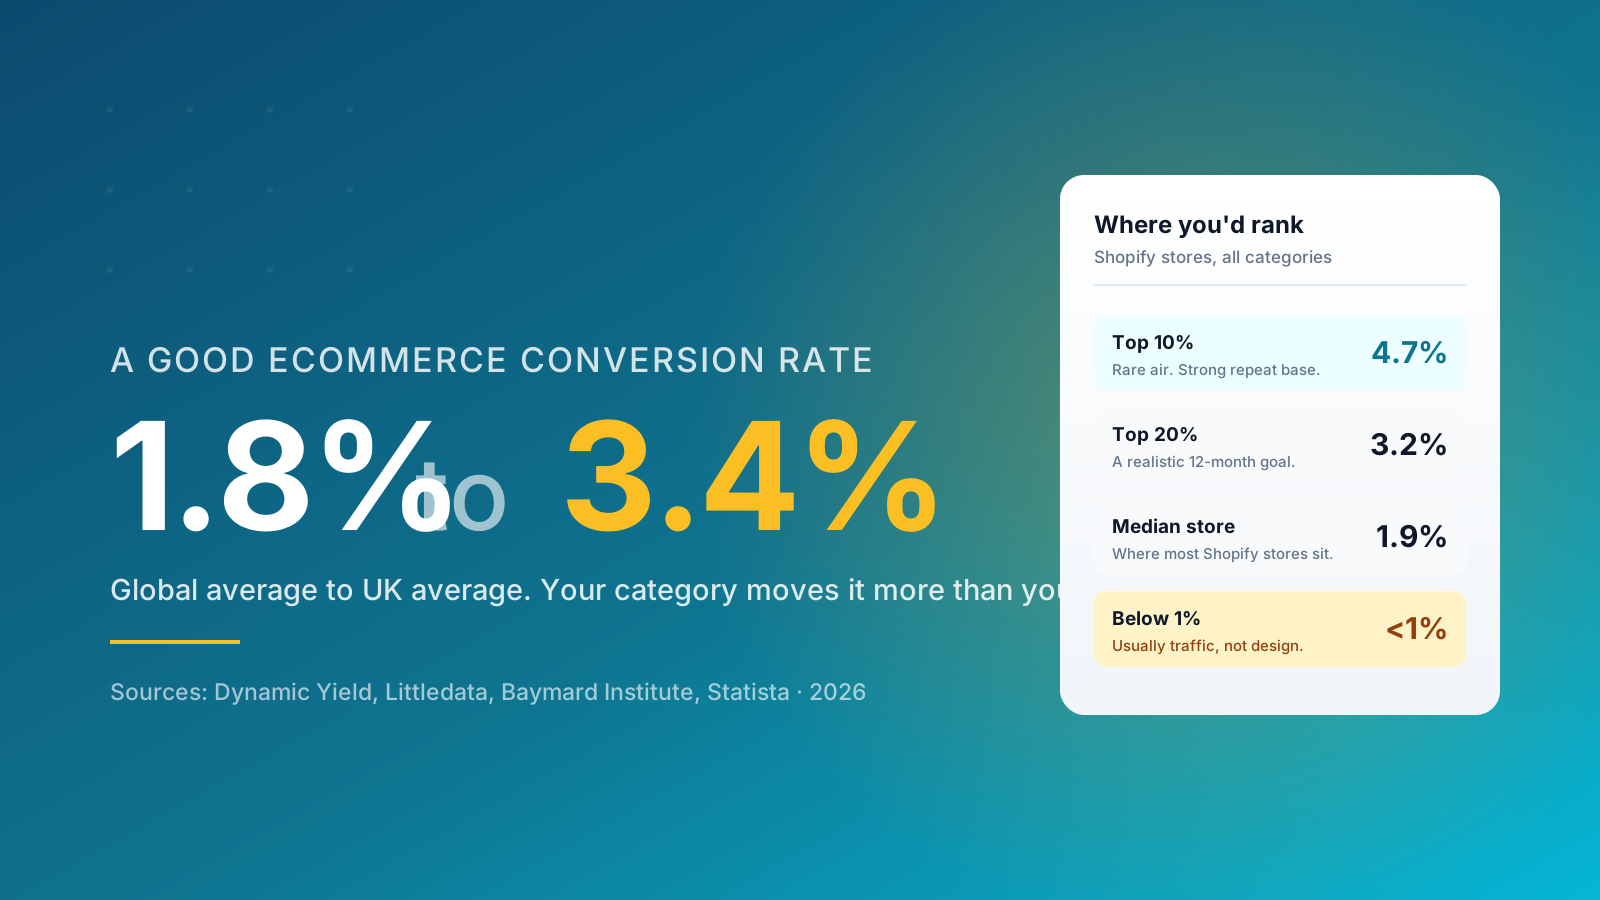
A good ecommerce conversion rate in 2026 is between 2% and 3% for most online stores. Above 3.2% puts you in the top fifth of Shopify stores. Above 4.7% puts you in the top tenth. Below 1% almost always points to a specific, fixable problem rather than a gradual one.
Those are the numbers people come looking for, so there they are. The more useful answer takes another sentence: a good conversion rate is one that is competitive for your category, your price point and your traffic mix, and that is trending upwards against your own baseline.
That distinction matters commercially. A jewelry brand converting at 1.2% may be outperforming a snack brand converting at 4%. Statista put the global figure at 1.6% of ecommerce visits converting into purchases in Q3 2025, while Dynamic Yield's benchmark data placed the global average nearer 2.95% over a similar period. Both are correct. They measure different populations of merchant, and both are describing a different set of industries.
So the practical use of a benchmark is orientation, not judgment. It tells you roughly which direction to look. It does not tell you whether your store is good, and it certainly does not tell you which part of your business to fix first. For that you need your own metrics, broken down far enough to be actionable.
The rest of this guide gives you the benchmarks by industry, device and channel, then shows you how to turn them into a target you can actually improve against.
How to Calculate Your Ecommerce Conversion Rate
The formula is simple, and getting it slightly wrong is the most common reason brands think they are underperforming when they are not.
Ecommerce conversion rate = (orders ÷ sessions) × 100
For example, if your site had 48,000 sessions last month and took 1,050 orders, your conversion rate is 2.19%. Run the same example with 48,000 visitors instead of sessions and you get a flattering number that no benchmark will match.
Two details decide whether your number is comparable to anyone else's:
- Sessions, not visitors. One person browsing on Sunday and buying on Monday is two sessions and one visitor. Dividing by visitors inflates your rate, sometimes by a third or more. Industry benchmarks across every source are built on sessions, so use sessions.
- Orders, not all conversions. Newsletter signups, account creations and add-to-carts are conversions in the general sense. Your overall site conversion rate will always look healthier than your ecommerce conversion rate, because it counts conversions that are not sales. When you compare yourself to a benchmark, compare completed purchases.
Keep the time window identical on both sides of the division. Mixing a monthly order count with a rolling 28-day session count produces a number that drifts for no reason you will ever be able to explain.
Why Every Source Quotes a Different Number
Read five articles on ecommerce conversion rate benchmarks and you will get five different averages, ranging from about 1.6% to over 4%. The sources are not sloppy. They are measuring different things, and four factors account for nearly all of the disagreement.
- Merchant size. Studies drawn from enterprise retailers report higher averages, often 3% to 4%, because those businesses have brand recognition, loyalty schemes and retargeting infrastructure. Studies that include newer and smaller stores trend towards 2% to 2.5%.
- The definition of a conversion. Some datasets count completed purchases. Others count any transaction event, including subscription renewals and point-of-sale sales synced back into the platform.
- Sample composition. A dataset weighted towards food and beauty merchants reports a materially higher average than one weighted towards furniture, electronics and jewelry. Both are accurate for the industries they sample.
- Measurement tool. Platform analytics, tag-based analytics and server-side tracking each count sessions and purchases differently. More on this below, because on Shopify it is the single most common source of confusion.
The correct response is not to hunt for the one true benchmark. Use ranges, pick the source whose merchant population most resembles your own business, and then benchmark hardest against your own trend. A store that can show it has improved its conversion rate three quarters running has more evidence of a working program than one quoting a favorable industry average.
Conversion Rate Benchmarks by Industry
Industry is the single most useful cut of benchmark data, because it captures purchase frequency and price point at the same time. The figures below come from Dynamic Yield's benchmark set and reflect the most recent full twelve months across these industries.
- Food and beverage: 6.22%
- Beauty and personal care: 4.94%
- Multi-brand retail: 3.93%
- Pet care and veterinary: 3.28%
- Fashion, accessories and apparel: 3.06%
- Consumer goods: 2.85%
- Home and furniture: 1.41%
- Luxury and jewelry: 0.94%
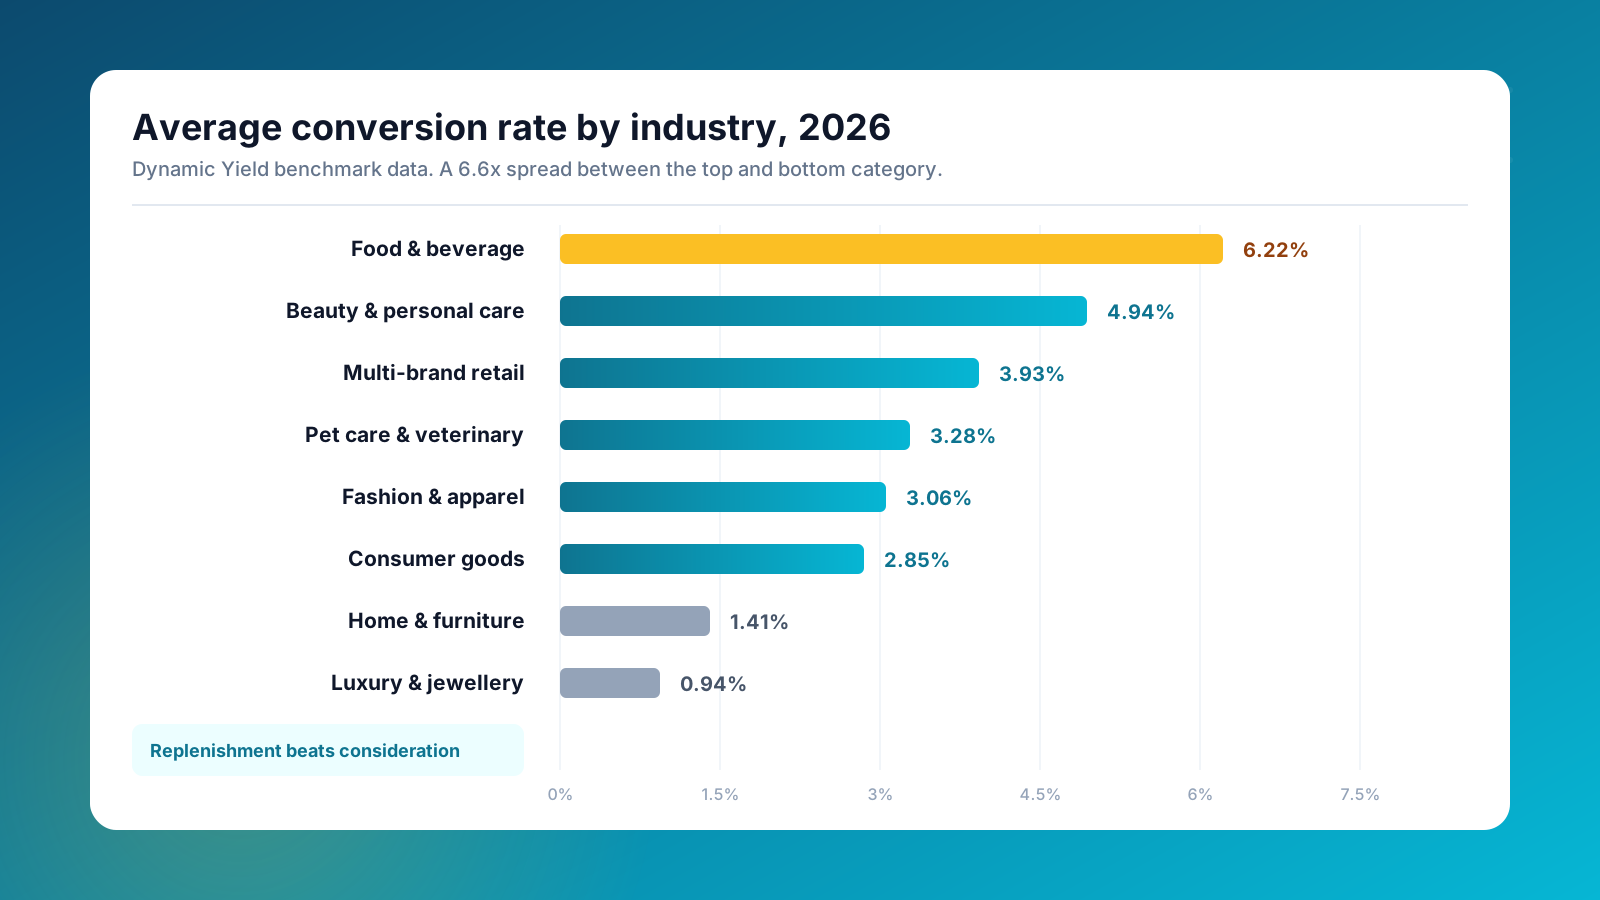
The gap between top and bottom is 6.6x. That is not a gap in execution quality. It is a gap in buying behavior, and no amount of site optimization closes it.
Food, beverage and beauty convert highest because the purchase is repeatable and familiar. The customer has bought the product before, knows what it costs and does not need to research anything. Replenishment does most of the selling, so these industries clear 4.9% without unusual effort.
Furniture, luxury, electronics and jewelry convert lowest because the decision is expensive, infrequent and usually spread across several sessions and often several devices. Consideration takes weeks. For example, a shopper researching a sofa on a phone at lunchtime and buying on a laptop that evening registers as two sessions and one purchase, which mathematically halves the apparent conversion rate for behavior that is entirely healthy. The same pattern shows up in electronics, where customers compare specifications across three or four sites before buying.
Plotting categories against average order value and purchase frequency makes the pattern clearer than a ranked list does.
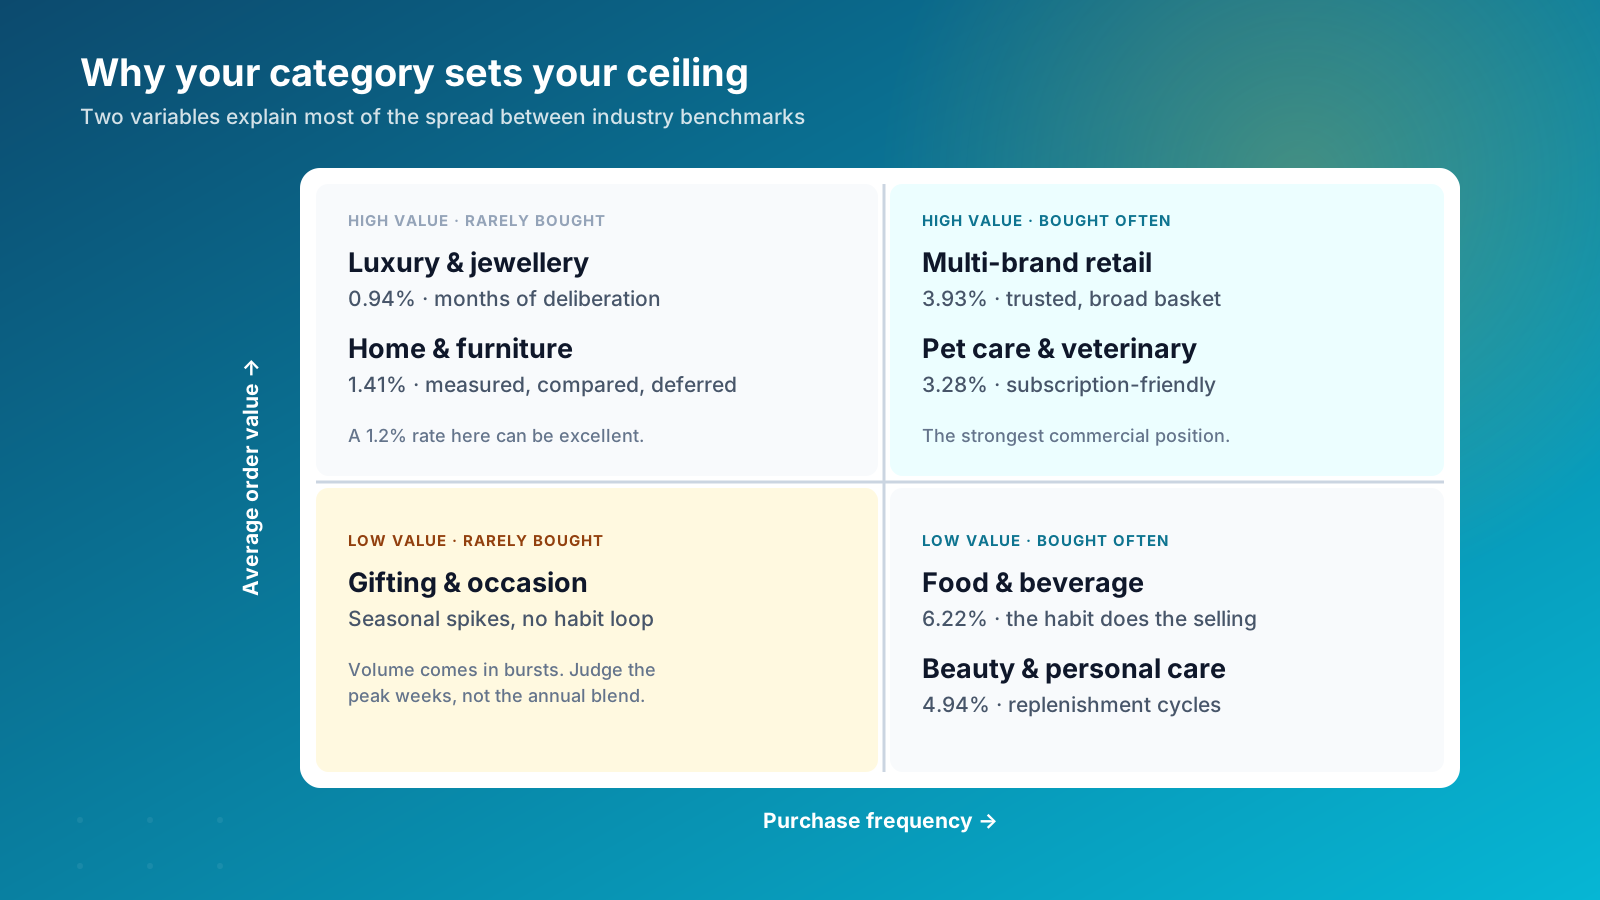
If you sell in the bottom-right quadrant, a 2% conversion rate is a problem worth investigating. If you sell in the top-left, 2% is a strong result.
US Ecommerce Conversion Rates
US stores sit close to the global average and behind Europe. Invesp put the Americas below EMEA, which leads at 4.11%, and most US-focused datasets land the domestic average between 2.5% and 3%.
Two structural reasons sit behind that. Sales tax is added at checkout rather than shown in the listed price, so the total moves at the last step and surprises a share of buyers every time. And shipping expectations set by the largest marketplaces are hard for independent stores to match, which makes delivery cost and timing the most common late-stage objection.
Category spread within the US is wide, and follows the same logic as the global picture. Grocery and household essentials sit at the top, often into double digits, because the basket is habitual. Beauty and supplements perform strongly on subscription-led repeat purchase. Considered, high-ticket categories such as furniture, appliances and fine jewelry sit at the bottom.
One caution for US brands selling internationally. If your Shopify store serves the US, Canada and Europe from a single storefront, your blended conversion rate is an average of markets with very different payment infrastructure and trust levels. A German customer who cannot pay on invoice and an Australian customer who does not see their usual installment option both convert worse than your domestic baseline, and they drag the headline number down while your US performance may be perfectly healthy. Segment by market before you draw conclusions.
Conversion Rates by Device
Mobile generates most of the traffic and a smaller share of the revenue. Statista put smartphones at roughly 78% of retail site visits worldwide in Q3 2025, producing around 70% of online orders.
That gap shows up starkly in abandonment. Baymard Institute records mobile cart abandonment at 80.45% against 68.62% on desktop, nearly twelve percentage points of difference for the same products at the same prices.
The gap is closing, but it is still the largest single structural drag on most stores' blended rate. If your mobile conversion rate sits more than 1.5 percentage points below desktop, there is a diagnosable problem rather than an inevitability. The usual friction points are practical: too many form fields at checkout, one-tap payment options not enabled, images heavy enough to delay the first meaningful paint, awkward navigation on small screens, and tap targets that are accurate on a design file and clumsy on a real handset.
Being responsive and converting on mobile are different achievements. A layout that reflows correctly can still lose sales at every step, because user experience on a handset is about sequence and speed rather than proportions. Mobile visitors abandon faster and forgive less. We cover the practical side of this in our guide to optimizing your Shopify store for mobile.
Conversion Rates by Traffic Source
Your blended conversion rate averages together audiences that behave nothing alike. Splitting by channel is usually the fastest way to work out whether you have a site problem or a traffic problem, and it is the first thing we look at on any new store.
- Direct: 3% to 6% for established brands. People who type your URL already decided.
- Referral: 4% to 5.4%. Consistently the most underrated channel. Visitors arriving from affiliates, review sites and editorial recommendations arrive pre-qualified.
- Email: 2% to 8%. The width of that range is entirely down to segmentation. A broadcast to a whole list sits at the bottom, a behavior-triggered flow sits at the top.
- Organic search: 2% to 4%, higher where the landing page matches the query intent tightly. Informational blog traffic converts far below transactional product traffic, which is expected rather than broken.
- Paid search: Varies enormously by category, but generally converts above organic because you are bidding on intent.
- Social media: 0.7% to 1.5% for cold audiences on Instagram, TikTok and Facebook. Retargeting campaigns typically convert two to five times higher.
A store running heavy top-of-funnel content or social media campaigns will always show a lower blended rate than a business living off email and returning customers. That is a description of the acquisition strategy, not a verdict on the website. Before you rebuild a product page, check whether the rate you are unhappy with is really just your channel mix.
Landing pages deserve their own read. A campaign sending paid traffic to a collection page rather than a purpose-built landing page frequently loses half its potential conversions before the visitor sees a product. Judge each landing page against the intent of the campaign feeding it, not against your sitewide average.
Shopify Conversion Rate Benchmarks
Shopify stores as a population sit slightly below the all-platform average, largely because the platform hosts an enormous number of young, small and experimental stores alongside established brands.
The working numbers to hold in your head:
- Median Shopify store: roughly 1.4% to 1.9%
- Top 20%: above 3.2%
- Top 10%: above 4.7%
- Median add-to-cart rate: 4.6% (Littledata, across more than 12,000 stores)
- Average checkout completion: around 45%
Shopify Plus stores generally sit higher, though the reason is worth being honest about. It is not that Plus makes a store convert better by itself. Brands on Plus tend to be further along, with more returning customers, better-known names and more mature retention programs. The platform removes constraints rather than adding conversions.
Having built and optimized more than 100 Shopify Plus stores, the pattern we see most often is that a business plateaus not because the storefront is weak but because nobody has separated the funnel into its component metrics. A 1.6% store and a 2.8% store frequently have near-identical product pages and completely different checkout completion. Until you split the rate, every attempt to improve it is guesswork.
That is also why platform-level averages are the weakest benchmark of the lot. They tell you where Shopify merchants sit in aggregate, which includes tens of thousands of stores with no traffic, no reviews and no marketing. Your industry benchmark is a far better yardstick than your platform benchmark.
Why Shopify and GA4 Report Different Conversion Rates
This is the question we get asked more than any other, and almost nobody writing about benchmarks explains it. Your Shopify admin and your Google Analytics 4 property will report different conversion rates for the same store over the same dates. Neither is broken.
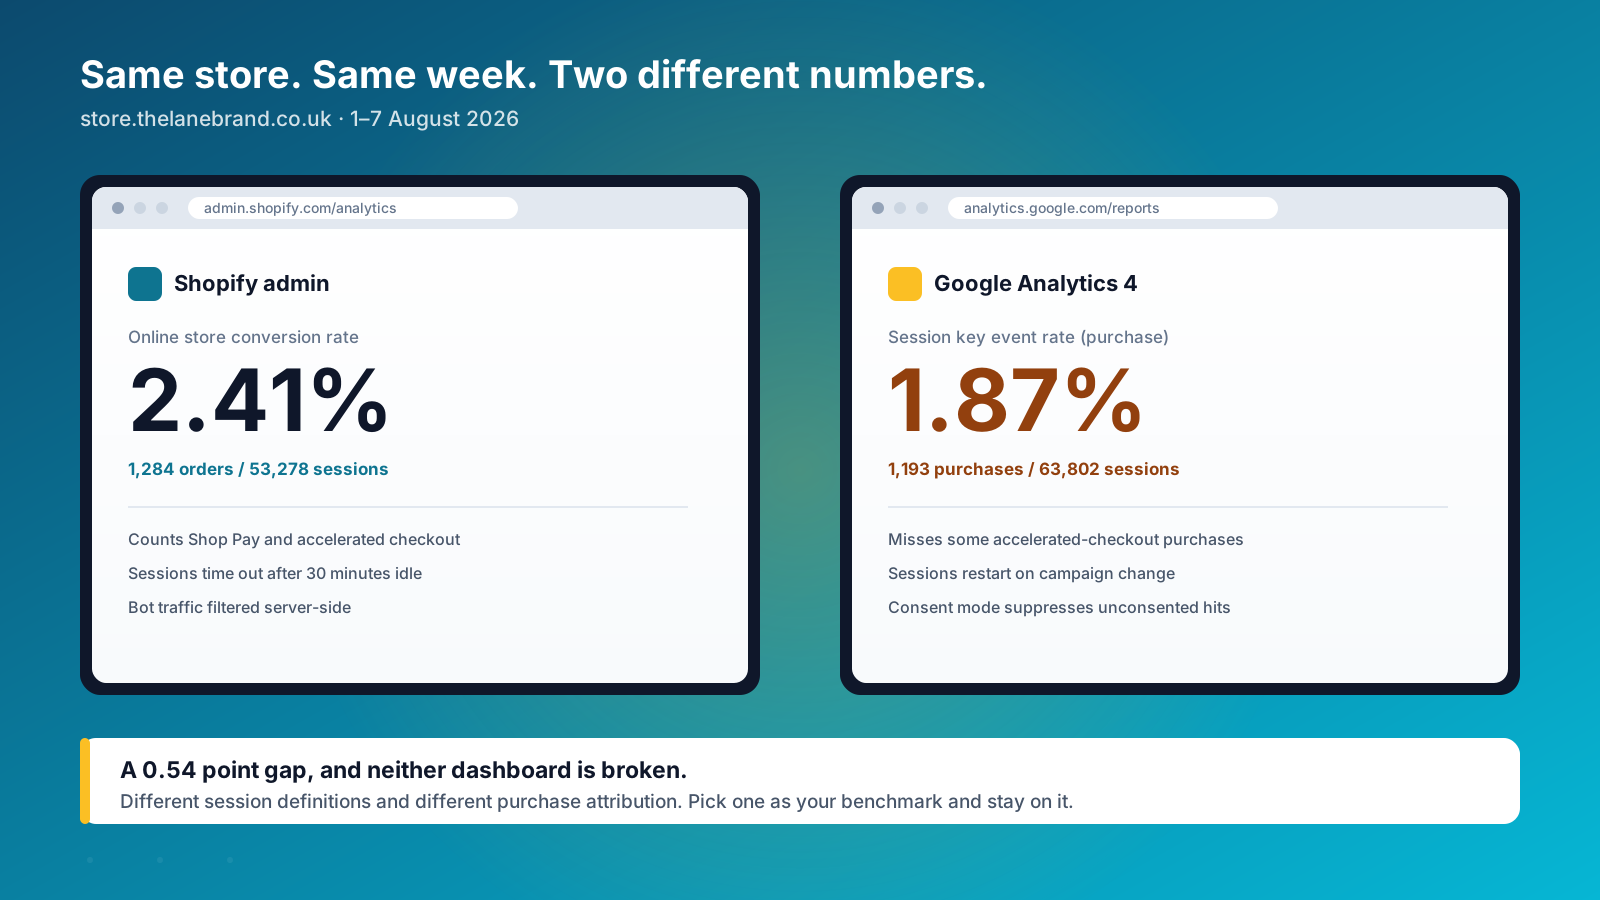
They disagree for four specific reasons:
- Sessions are defined differently. Shopify closes a session after 30 minutes of inactivity. GA4 does the same but also starts a new session when the campaign source changes mid-visit. A shopper who clicks a Google ad, leaves, then returns via an email link generates one Shopify session and two GA4 sessions. More sessions on the denominator means a lower reported rate.
- Accelerated checkout is attributed differently. Shop Pay, Apple Pay and Google Pay purchases sometimes complete without firing the events GA4 depends on, particularly where the buyer never reaches a conventional checkout page. Shopify records the order regardless because it owns the transaction.
- Consent mode suppresses hits. If a visitor in the EU, or in a state with an opt-out privacy law such as California, declines analytics cookies, GA4 either models or drops that session and any purchase within it. Shopify's server-side record is unaffected.
- Bot filtering differs. Shopify filters a good deal of automated traffic server-side. GA4 applies its own list, and the two do not match.
A gap of 0.3 to 0.8 percentage points between the two is normal. A gap of two points or more usually means a tagging problem worth investigating.
The practical rule: pick one source as your benchmark, and never change it mid-year. We generally recommend the Shopify admin figure for benchmarking, because it is closest to the order data your finance reporting uses, and GA4 for diagnosis, because its channel and landing page breakdowns are richer. Comparing a Shopify number to a benchmark built on GA4 data will flatter you by a few tenths of a point, which is worth knowing before you celebrate.
The Metrics That Matter More Than Your Headline Rate
A single conversion rate tells you that something is wrong. It never tells you what. Three sub-metrics do, and these are the metrics worth putting on a dashboard alongside your headline rate.
- Add-to-cart rate. Sessions that add at least one item. Median around 4.6%. A weak figure points at product pages, pricing, imagery or merchandising.
- Cart-to-checkout rate. Carts that reach the checkout process. Weakness here usually means shipping cost or delivery timing surprised the customer.
- Checkout completion rate. Checkouts that become purchases. Around 45% on average. This is where the most recoverable sales in ecommerce sit.
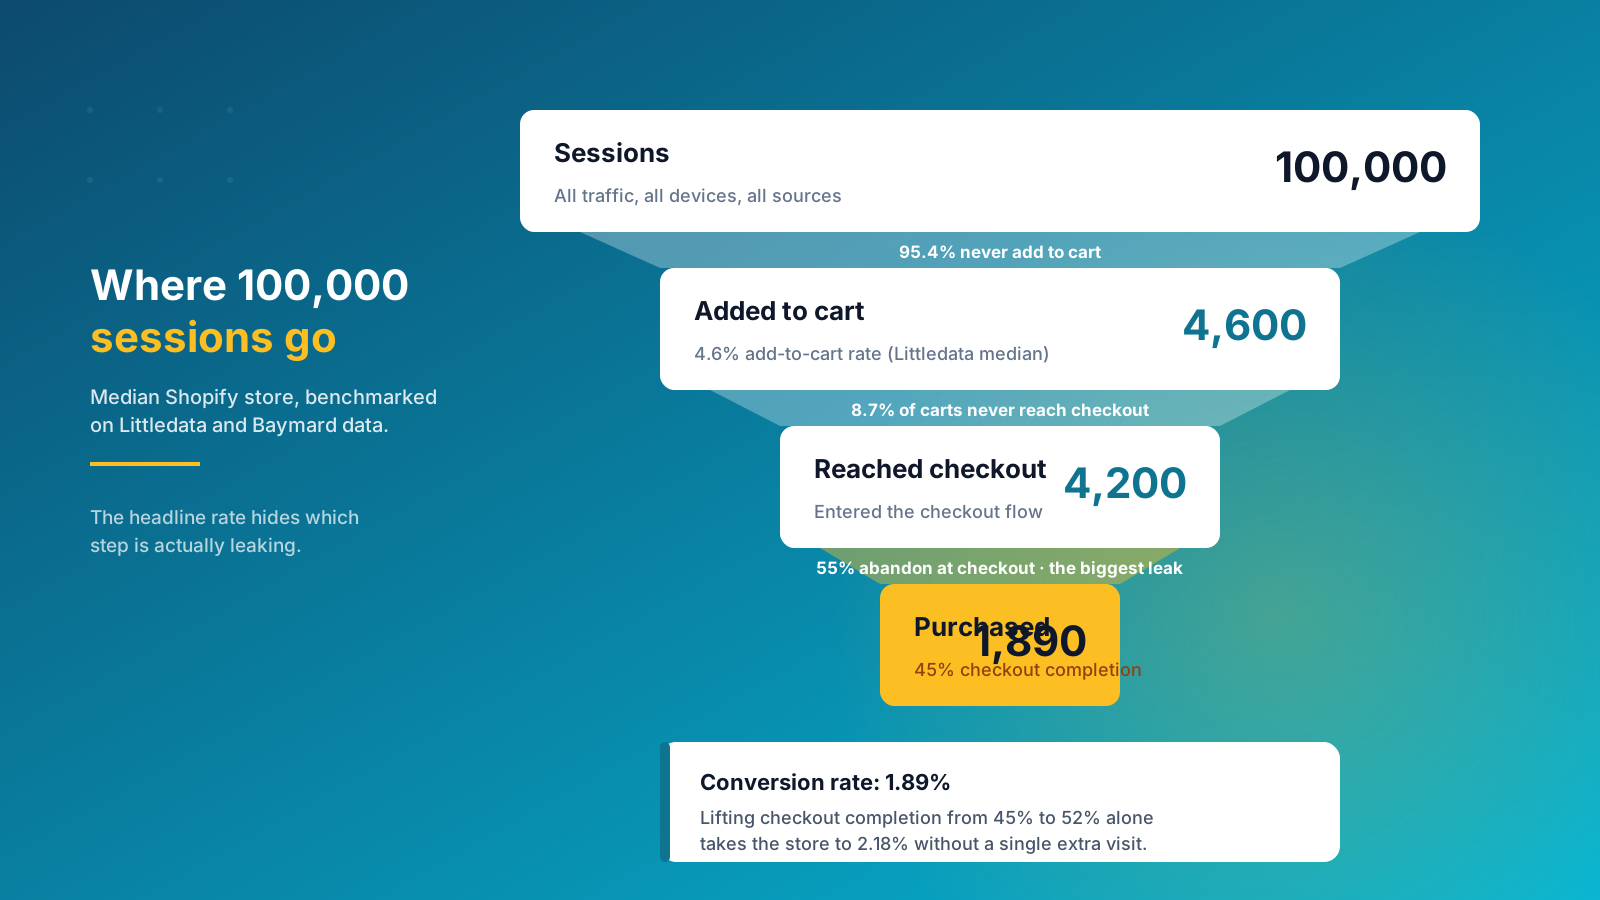
Work through the example on a site with 100,000 sessions. A 4.6% add-to-cart rate produces 4,600 carts. Around 4,200 reach checkout. At 45% completion, 1,890 become purchases, giving a conversion rate of 1.89%.
Now improve checkout completion from 45% to 52%, a realistic outcome from removing forced account creation and surfacing delivery cost earlier. The same visitors produce 2,184 sales and a 2.18% conversion rate. That is a 15% revenue increase with no additional traffic and no change to a single product page.
This is the part most brands skip. They set out to improve the headline number, run a series of unrelated tests, and cannot explain afterwards which change produced which result. Improving one named sub-metric is a project a team can actually finish.
This is why the headline rate is a poor place to start. Baymard Institute puts average cart abandonment at 70.22% and estimates that a large ecommerce site can gain 35.26% in conversion from checkout design alone. The average checkout still shows 23.48 form elements by default, which is roughly twice what most orders actually require.
Our guides to reducing cart abandonment and Shopify one-page checkout go into the specific fixes.
How to Set a Realistic Conversion Rate Target
Borrowing someone else's average as your target is how CRO programs end up chasing a number that was never achievable. Build your own instead. Four steps.
1. Establish your baseline properly. Take a full twelve months so seasonality cannot distort it, from one source, segmented by device and by market. You now have four to eight real numbers rather than one blended one.
2. Pick your comparison set deliberately. Choose the benchmark whose merchant population resembles yours on three axes: category, average order value and traffic mix. A benchmark drawn from enterprise multi-brand retailers is the wrong yardstick for a single-brand store with a $180 average order value.
3. Set the target on the weakest sub-metric, not the headline. If your add-to-cart rate is competitive and your checkout completion is 38% against a 45% benchmark, your target is a checkout target. Naming it that way tells the team what to actually do.
4. Attach a revenue number to it. Multiply the projected uplift by your sessions and average order value. For example, a move from 1.9% to 2.2% on 400,000 annual sessions at $65 average order value is roughly $78,000 in additional sales. That figure is what gets the work prioritized, and it is also what tells you honestly whether the project is worth doing at all.
Track it alongside your other commercial KPIs rather than in isolation. Conversion rate, average order value and customer lifetime value move together, and a change that lifts one while damaging another is not an improvement. Aggressive discounting is the classic example: conversions rise, margin falls, and the business is worse off.
Then judge yourself against your own trend. A store that moved from 1.3% to 1.9% over six months is doing better work than a store that has sat at 2.5% for two years.
How to Improve Your Ecommerce Conversion Rate
Before the tactics, the factors. Five things move conversion rates far more than anything else, and most stores get the ordering wrong.
- Traffic quality. The biggest single factor. If the visitors arriving do not want what you sell, no amount of on-page work rescues the rate. Check performance by channel and campaign before you touch the site.
- Intent alignment. Every page should match the intent of the visitor landing on it. A page answering an informational query should earn trust and move people forward, not push for an immediate purchase.
- Page speed. Conversion rates peak when pages load in around three seconds, and each additional second measurably costs sales.
- User experience on mobile. Navigation, tap targets, form behavior and image weight all affect mobile conversion independently of whether the layout technically adjusts.
- Trust. New visitors need more reassurance than returning customers. Customer reviews, testimonials, clear returns policies and recognizable payment methods all measurably reduce hesitation.
Once you know which factors apply and which step leaks, the fixes are reasonably well established. In rough order of return on effort:
- Take friction out of checkout. Enable guest checkout, cut optional form fields, show delivery cost and timing before the final step, and offer the payment methods your customers actually use. This is consistently the highest-leverage work available.
- Fix mobile properly. Test on real handsets, not a resized browser window. Enable Shop Pay, Apple Pay and Google Pay. Compress images aggressively.
- Make the value proposition immediate. A first-time visitor should understand what the product is, who it is for and why it beats the alternative without scrolling or thinking.
- Place trust signals where hesitation happens. Customer reviews next to price and near the add-to-cart button, testimonials on landing pages, returns policy visible before checkout rather than buried in the footer.
- Improve page speed. Conversion rates peak when pages load in around three seconds, and every additional second measurably costs you sales. See our guide to speeding up a Shopify site.
- Use personalization where it earns its keep. Recommended products and recently viewed items lift engagement for returning customers. They do very little for first-time visitors, so measure the effect by segment rather than sitewide.
- Segment before you optimize. A change that helps desktop customers can quietly hurt mobile ones. Read results by segment, always.
Start with behavioral data rather than opinion. Quantitative analytics tools tell you where visitors drop off. Session recordings and heatmaps tell you why. Forming a hypothesis from a recording of somebody failing to complete a purchase produces better tests than a list of best practices ever will.
Then run the change as a proper test. Ship it to half your traffic, leave it long enough to reach significance, and read the result against the sub-metric you set out to improve rather than against the headline rate. CRO done this way compounds. Done as a series of unmeasured redesigns, it mostly produces opinions.
Two other things worth saying about CRO tools. Analytics tools tell you what happened, so pick one and stay on it. Session tools tell you why, and they are where the useful hypotheses come from. A store with three analytics tools and no session recording has a lot of data and very little insight.
A realistic first CRO program runs for two quarters, targets one funnel metric, and reports on engagement and revenue metrics alongside the conversion rate so nobody mistakes a discounting effect for an improvement.
For the full method, read our guide to improving your ecommerce conversion rate, or see what a structured program involves in what a CRO agency does.
If you would like a view on where your store is losing orders, our Shopify Plus agency team can help. Get in touch and we will talk through your numbers.